Realtime Results Livestream
*This is a mirror to the content posted on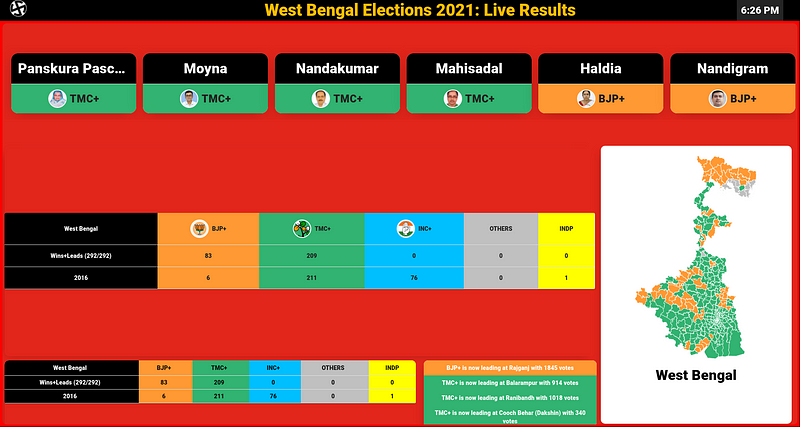 Get ready for a quick tech thrill! Last month, we dove into a time-sensitive project for the West Bengal state elections - a 5+ hour YouTube Livestream featuring real-time data in a dazzling design. This blog spills the secrets behind the scenes, from coding marathons to unexpected triumphs. Fasten your seatbelts - it’s a tech spectacle you won’t want to miss! 💻🌐🎥
Now, let’s get real. We had zero experience with a programmatically defined dynamic Livestream. None. Nada. Zilch. But hey, where’s the fun in sticking to the tried and tested?
The Stream Design
I already had the idea to add a dynamically generated state map based on the party’s colour with a lead on the constituency. This is what we (I and Karthik(Karthik Iyer)) envisioned our final design to be:
- A state map dynamically generated. Maps for phases and district as well.
- State-wise overall results of the 5 states on the poll
- Constituency-wise leads. (Party-Coalition and candidate leads)
- Comparison with the past result
- Dot-semicircle pie chart (for visualizing majority)
- Projected total seats
- Notification panel (Recent flips in constituency leads)
- Time, Name & Logo
~ Alas, we dropped some of these in favour of some of the important ones.
The Pipeline Design
We designed individual components in this pipeline in parallel, using basic classes (to be subclassed later) in the backend. Every component was designed to reduce the coupling amongst them so that a crash on the scraping module (or even the backend in general) won’t affect the frontend logic. This was mainly done because of the uncertainty in the pipeline with respect to the scraper and the procured data. The main reason was that this script was to be developed on D-day only (for obvious reasons).
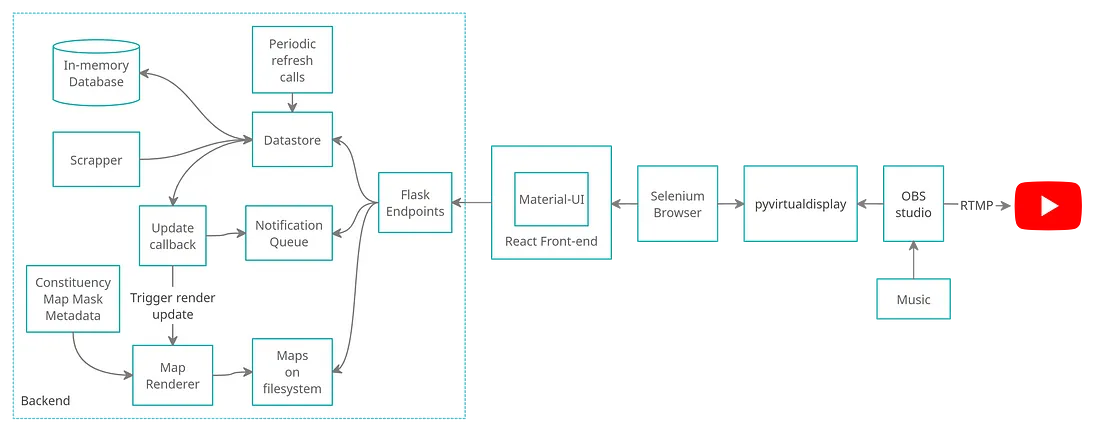
Pipeline diagram
Major components in the pipeline were:
- Backend: Actual scraping and database logic with map rendering logic exposed through Flask APIs
- Frontend: React app with Material UI components for elegant and easy design.
- Selenium Browser & pyvirtualdisplay: A chrome instance with the frontend running in the background (to replace the need for a secondary display).
- OBS studio: Tool to capture and stream the virtual display to YouTube.
This pipeline by design has got a number of resource-intensive services running. Henceforth, we focussed on reducing the back-end processing by always leveraging cached data for the API calls. We prefetched and stored all that we could, like candidate details, for example. We only scraped constituency-wise per candidate vote count on the go. The frontend periodically queries the backend to check for updates. And the backend independently updates the database and maps. A periodic refresh task triggered the scraper, which then updated the database’s state continuously. This essentially made the backend logic independent of the API calls.
We developed events-based callbacks triggered by events, like when the leading candidate in a constituency changed or when the overall ranking changed.
Map Rendering
The map renderer registered itself with these callbacks, through which it received just the updates in data. We created metadata for rendering the maps beforehand. We were able to find a constituency level map of West Bengal in the MS Excel Map format through sheer luck. It contained all constituencies, paired with an integer value and a chart map highlighting individual constituencies based on these values. We wrote an Excel macro that changed the value paired with each constituency, highlighted it yellow and took a screenshot. All automated. Generating metadata after this was simple. A simple python script that cropped the screenshots to the appropriate dimensions, found all the pixels coloured yellow and stored the pixel coordinates in a simple text file.

Map rendering individual constituency
When the server starts, it loads all those pixel coordinates into an array. When the update callback is triggered, we fetch these coordinates only for those constituencies which actually changed and re-render just these pixels. We used Pillow to render the images. Once updated, the image is saved onto the filesystem. When the frontend requests for a map, it is fetched from that cached map from the filesystem. To ensure thread-safety for simultaneous read-update to the filesystem, we came up with this solution: to preload paths to all the map images in an array, use paths from this array while saving or reading an image use a thread lock on the path strings.
Results
All set and done, the live stream worked perfectly for more than 5 hours.
Running this heavy pipeline on a single device did take a toll on the performance. It was mostly around dropping frame rates, but it was unnoticeable on the stream for the most part. Below are the details for the environment running the pipeline:
Ubuntu 20.04 LTS Linux with 5.8.0 kernel on Predator Helios 300 with Intel corei7 9th gen processor, 16 GB RAM & 6 GB NVIDIA GeForce GTX 1660 Ti Graphics card.
Flask and React app was running on debug mode and OBS studio
Before closing the stream, I recorded these system statistics.
The performance was getting increasingly poorer as we approached towards the end of the stream.
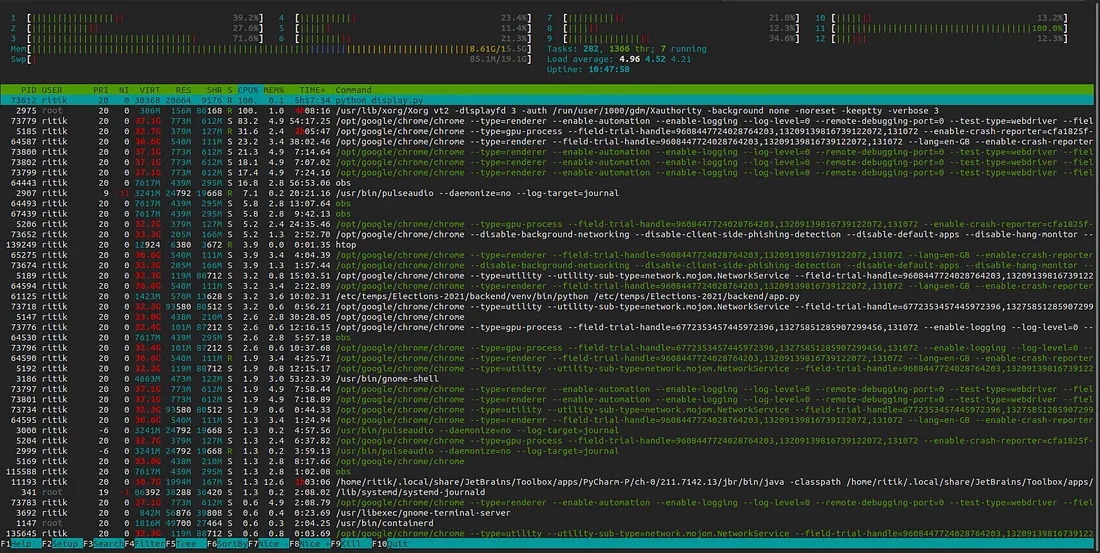
htop
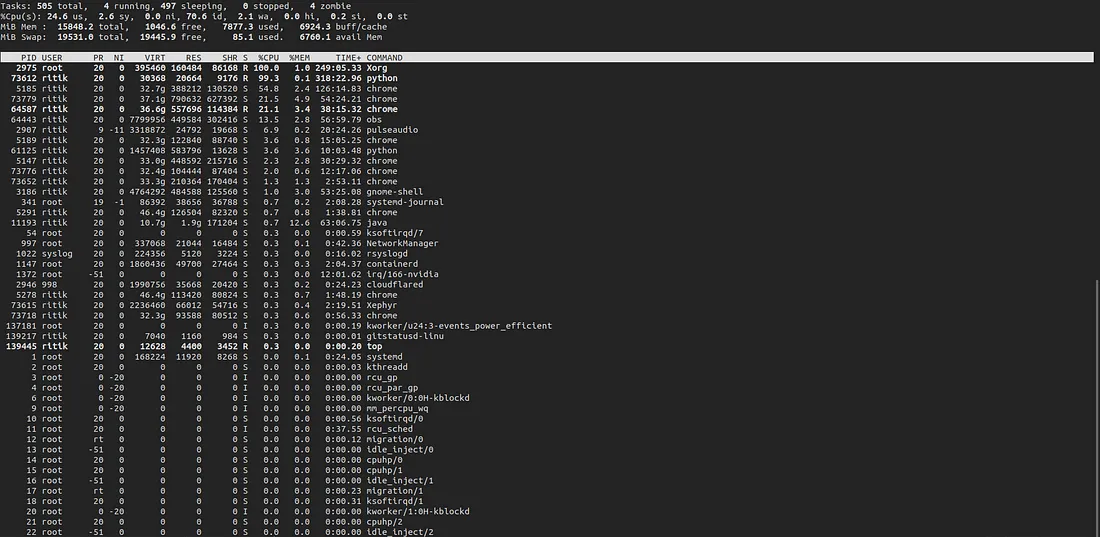
top
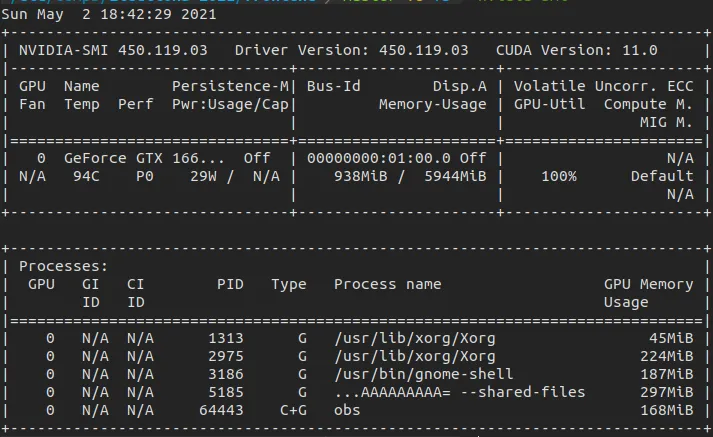
nvidia-smi
Note that
- The backend was running through the Pycharm’s terminal.
python display.pyis the process runningpyvirtualdisplay+selenium process.- Google-Chrome was also running parallel.
Other processes are rather self-explanatory and/or mostly comes preinstalled with standard Ubuntu desktop installation.
read more...
